The housing crisis we are facing today is without precedent. Although there have been many housing bubbles in the past, the mess we got ourselves into this time will go into the history books as giant Wall Street financial institutions go from billion-dollar companies to being worth… nothing.
I have said several times that as potential home buyers today, now, is the time to save your cash. Sure, if you’re looking into the Inland Empire or Antelope Valley, there are plenty of unbelievable deals out there. But here, the San Gabriel Valley, has some time to go before prices correct themselves.
Now that the hype is over, people are starting to realize that million dollar plus McMansions are expensive to maintain and $700,000 for a fixer-upper is a horrible deal. People are also starting to realize that Arcadia is no San Marino and actually more comparable to Temple City (not saying that TC is bad).
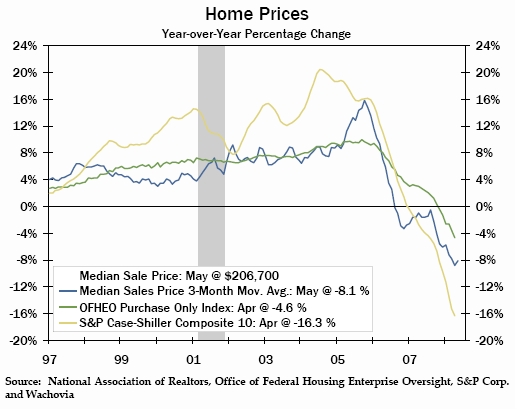
No matter where you look, everything points to more declines in home prices. Here are figures from 3 major trackersL
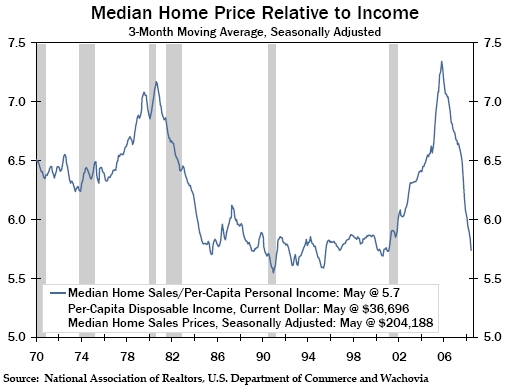
Not surprisingly, home prices had skyrocketed beyond relative income levels:
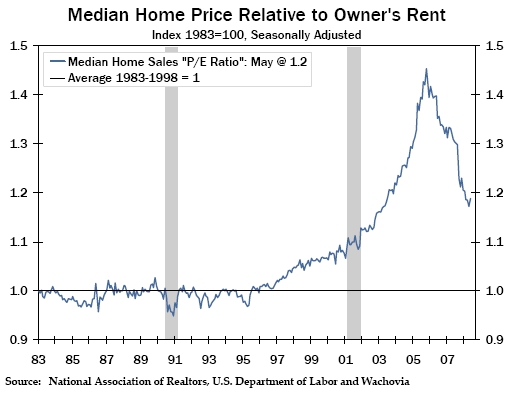
In a normal market, people buy houses because it is better than paying rent. During a bubble, it is much cheaper to rent than to own. It is no different in Arcadia, Temple City, Monrovia and Pasadena. Today, it is a lot cheaper to rent in these cities because home prices are out of line with fundementals. There was a reason that $700k PUDs in Arcadia were selling for only $400k just 5-6 years ago.
I know too many people in the Rowland Heights, Diamond Bar, Yorba Linda and even Irvine regions that argued prices in their area wouldn’t drop much due to ‘stellar’ schools, excellent location and a central hub for Asian immigrants.
Two years later those same people are split into 2 groups:
Group 1: They didn’t buy but claim that NOW is the best time to purchase before prices skyrocket again. (?!?)
Group 2: This group bought and feel that it’s necessary to justify their purchase because it was “the home” and they got a great deal on it (despite being underwater on their loan).
Both groups now say that it is ok to buy if youplan to hold on for 5 years
Does this sound like denial to you? Although I know that everyone is on the lookout for their dream property, buying a home is one of the biggest financial decisions someone will make in their lifetime. There is very little room for choices based on emotional attachment or denial of fact. I believe that everyone should work hard to buy a home one day.
Unfortunately, as an Arcadian renter, today is not it.
*******************
Calling the “bottom” isn’t that important to me because when the time to buy is here, there’s no way you can miss it. Just compare the price relative to your household income and figure out the difference between the cost to rent versus owning. Trust me, if you sit down and run the numbers, the decision will be easy. But if you insist, here is my call:
November 2010
Sure, 2009 will be a dismal year with plenty of false hope. Wait until after the Summer of 2010 because that’s when the reality of real estate will sink in: homes, unlike stocks, are illiquid assets and make horrible investments. But they are great for growing families and individuals wanting to settle into one location.


Arcadian, the denial is everywhere. Stunningly, even some realtors are in denial or is it lying?
Nevermind the silly asking prices surpassing 2006 sales prices but the confirmation of denial is the large number of homes for RENT!!!
The LA Times has a piece today on people who could not sell their homes so they rented them and purchased elsewhere. Talk about doubling down! 10yrs from now they will be at break even or will have been broken down by playing landlord. One couple, a teacher and housewife, in their mid 40s are carrying 2 mortgages with one of the properties rented out. How much do you think they are saving for their future retirement? Like many others I believe this period in history will have broken them financially for the rest of their lives unless something extraordinary happens. You cannot recover from something like this unless you make major lifestyle changes.
The reality is so plain to see I can’t understand how so many are blind to it. Over 4 million homes for sale, with 2 million in or near FX. Inflation raging. Unemployment spiking. Credit more difficult to obtain.Rising utility costs.
How does that spell a recovery? I bought long long ago and would be happy if I could sell at current prices 10yrs from now. That’s right, I expect no real appreciation [meaning post inflation] over the next 10yrs.
Great blog.
Hmm, at least the relative income chart seems to indicate it’s normalized and even more affordable than in the 70’s. Of course no two times are exactly the same.
I agree with ARC LOST– the relative income chart is very, very interesting.
It strikes me as more relevant to calling a bottom than any rent equivalence test. The problem with rent equivalence is that renting will never be equivalent to buying. It’s apples and oranges. And comparing current rents to current costs of ownership as a way to determine when to flip from renter to buyer just doesn’t work.
If you really want to compare renting to buying, you’d need to project rents over the same period as your mortgage, gross up rents to compensate for the ownership rights and upside option you don’t get as a renter, bring that all back to present value and then go from there. Even if rents are currently substantially lower than carrying costs for a comparable home (and ignoring the important psychic and practical differences between being an owner and a renter), you may be better off buying because rents will always rise in nominal terms, while your 30-year mortgage gets less and less expensive every year.
Of course, there isn’t a buyer in the world who actually does this kind of calculation in their heads. Instead, they make a decision to buy, and then figure out what they can afford.
As somebody actively looking to buy, but with a 9-12 month time period before life circumstances really force me to pull the trigger, the most frustrating thing is that the levee on prices in SGV just doesn’t seem to want to break.
Perfect example is 1031 Foothill. You guys profiled this property a while back. I actually pursued buying it. The seller was asking about $2.1M after buying it for $1.7M in 2005 and putting some money into it (but no way did they put $300K into it). I figured I could live with paying $1.6M or $1.7M, which struck me as overpaying a bit, but not so much that I’d regret it.
It sold on July 14 for $1.95M. All I can do is shake my head.
This may be the exception that proves the rule, but it just encourages other folks to list their homes for as much or more than their initial purchase price from back in the bubble. I see this everywhere– nice homes, good lots, that if priced right I’d jump on. But instead of offering a discount from their 2006 or 2007 purchase price, they’re asking for hundreds of thousands more.
So, nothing sells except for the rare property– like 1031 Foothill– that attracts a foolish buyer. Meanwhile, more rational buyers like me are forced to sit on the sidelines.
By the way, any chance you have access to data that could replicate the price / income chart just for Arcadia?
I question that Median Home Price Relative to Income chart. That chart shows it being at almost the same level as 2001 levels. Just think about it for a minute. Where have prices gone since 2001? They have more than doubled. In order for that chart to make sense now, the average household income for arcadia would also have to have doubled. Did it? I don’t think so. I think that in the last 7 years, household income hasn’t gone up anywhere near that much.
Check out the housing value to income ratio calculator here:
http://www.ushousingmeltdown.org/house-value-to-income-ratio.asp
It shows the ratio at 13.9 for the 91007 zipcode and 11.6 for 91006.
Just a note: These charts are based on Median home prices on the national level. We have seen 25-40%+ drop of median levels throughout major regions in the U.S. so obviously the Arcadia is still playing catchup in terms of declining prices.
Hi Jonathan,
Thanks. I was about to run those figures from US Housing Meltdown this morning but you beat me to it.
I’d just like to add that while the NAR numbers do show a return to “fundamentals” for P/I nationally, their number is really, really bad financial planning.
If you pay a P/I of 5.5 and put 20% down, that leaves you with a mortgage of 4.4X your income. That means that almost 50% of your household income is going to PITI.
That means you are a house-slave. No savings. No vacations. No private school. Probably lots of mac’n cheeZe
I can see the problem with having no savings and being a salve to your mortgage BUT what’s wrong with Mac n’ Cheese?
my two cents…
Is that the bottom is a long way off, more like early 2010.
February 2010 is my prediction…
Depressing.
You are very conservtive. My prediction to bottom out is around 2012 to 2013.
I can’t think of anything better )